


Interpreting the Spike in Suspicious Cricket Match Alerts
The 2025 Sportradar integrity report dropped onto my screen in early 2026 and I read it three times before writing anything about it. The headline number — 59 cricket matches flagged as suspicious in 2025 — looks digestible until you put it next to the previous four years. Cricket “more than tripled any of the previous year’s levels dating back to 2021”, the report notes. That isn’t a marginal uptick. It’s the sharpest single-sport rise across Sportradar’s 70-sport surveillance footprint, against a global trend that was flat or declining elsewhere.

Anyone who bets cricket professionally pays attention to integrity numbers, not because they expect to encounter a fixed match — odds are vanishingly slim in mainstream UK markets — but because what the data shows about the corruptors’ targeting tells you where the “soft” tournaments and the suspicious price patterns live. The flagged matches are concentrated in lower-tier franchise leagues, which has direct relevance to where regulated UK punters should and shouldn’t be putting their money.
How Sportradar’s Fraud Detection System Actually Flags a Match
The Universal Fraud Detection System — UFDS — is the engine behind every Sportradar integrity alert. It runs on a continuous feed from bookmakers worldwide, monitoring odds movement, stake patterns, and market behaviour across pre-match and in-play markets simultaneously. The system isn’t designed to identify “fixed” matches in any direct sense. It’s designed to identify market behaviour that’s statistically inconsistent with the publicly available information about the match.

The flagging logic combines several signals. The first is odds movement against the expected pattern — for example, a match where the favourite drifts significantly in the hours before the start despite no relevant news, or where in-play prices move against the run of play. The second is stake distribution — unusual concentrations of money on side markets like first-innings totals or session runs that wouldn’t normally attract heavy volume. The third is cross-market correlation, where movements in one market predict movements in another in ways that suggest informed trading rather than random fluctuation.
The system flags around 0.1 percent of monitored matches. Sportradar monitored over 1 million events in 2025, with 99.5 percent of them assessed as “free from suspicion”. The 0.5 percent that doesn’t clear that bar isn’t necessarily fixed — it’s market behaviour that the system can’t reconcile with publicly available information. Some flagged matches turn out to have innocent explanations once additional investigation occurs. Others trigger formal disciplinary processes by the relevant governing bodies.
The UFDS AI Upgrade: A 56 Percent Lift in Alerts in 2025
The 2025 uplift in detected suspicious matches isn’t purely a real-world signal. Sportradar deployed a significant AI upgrade to its UFDS system in 2025, which produced a 56 percent rise in flagged matches across all sports — from 436 in the previous baseline to 682 under the upgraded system. The cricket figure of 59 sits inside that broader uplift, but with a sharper rise relative to baseline than the all-sport average.

The methodological question is how much of the cricket spike is “more matches actually fixed” versus “more matches now detected with the upgraded system”. The honest answer is both, and Sportradar’s own commentary in the report is careful to distinguish detection from underlying activity. The 56 percent lift in alerts is partly a recalibration effect — the new model surfaces patterns the old one missed — and partly a genuine signal that corruption activity has migrated toward cricket in detectable ways.
The most striking comparison is the divergence between cricket and the global trend. Total suspicious matches across all 70 monitored sports came in at 1,116 in 2025, a marginal 1 percent decline year over year. Europe specifically saw 385 suspicious matches, 66 fewer than the previous year and a second consecutive annual decline. Cricket’s tripling against that backdrop tells you the corruption activity is migrating into the sport rather than reflecting a general uptick.
Why Cricket Numbers Diverged From the Global Trend
Three structural factors drive cricket’s anomalous integrity numbers in 2025. The first is the explosion of franchise T20 leagues outside the established calendar. New franchise competitions in tier-two cricket nations have produced an oversupply of matches relative to robust governance infrastructure, and corruptors target precisely those competitions because the regulatory oversight is thinnest there.

The second is the structural targetability of cricket as a sport. Cricket has many discrete moments within a single match — every ball, every over, every wicket — that produce separate betting markets. A fixer doesn’t need to influence the outcome of the entire match to monetise a corrupt event; influencing a single over’s runs or a particular dismissal type can produce enough profit to justify the risk. The granularity of cricket markets is itself a vulnerability.
The third is the persistent presence of large illegal betting markets in cricket-following regions. The bulk of suspected fixing-related stake flow doesn’t move through UK-regulated markets — it moves through illegal operators in regions where cricket betting is either banned or operates outside formal regulation. The UK’s offshore market, estimated at around £685 million GGY in 2025, is part of this broader picture, but the larger volumes are in subcontinental and Southeast Asian illegal markets.
Regional Patterns and Where Alerts Cluster
The geographical distribution of cricket alerts in 2025 follows the franchise league map. Mid-tier T20 leagues in countries with developing cricket governance produce the bulk of flagged matches. Lower-tier domestic competitions in major cricket nations produce a smaller but meaningful share. Bilateral international fixtures involving tier-one cricket boards produce almost none.

This pattern matters for UK punters because it tells you exactly where the integrity risk lives. The Ashes, ICC tournaments, the IPL — these mainstream competitions show essentially no suspicious activity in the Sportradar data. The County Championship and Vitality Blast in England show none either. The risk lives in tier-two franchise leagues — competitions that UK regulated operators sometimes price on their cards but that sit far from the mainstream attention of punters.
The practical implication is that bet selection is the integrity safeguard for UK punters. Sticking to the mainstream UK calendar — domestic English cricket, the Ashes, ICC events — keeps you on the right side of the integrity map. Betting heavily on tier-two franchise leagues with no first-source coverage and minimal mainstream attention puts you in the segment of the market where the corruption activity is concentrated. The book may take your bet, but the underlying pricing on those matches reflects market uncertainty that’s partly a function of the integrity risk premium.
Education as the Counterweight: 34,000 Participants in 2025
The Sportradar Integrity Education programme reached over 34,000 participants in 2025, a 25 percent rise year over year. The programme covers players, coaches, officials and administrators across the 70 sports the firm monitors. Cricket is one of the larger participating sports because the ICC and most national boards run mandatory integrity education modules for centrally contracted players.
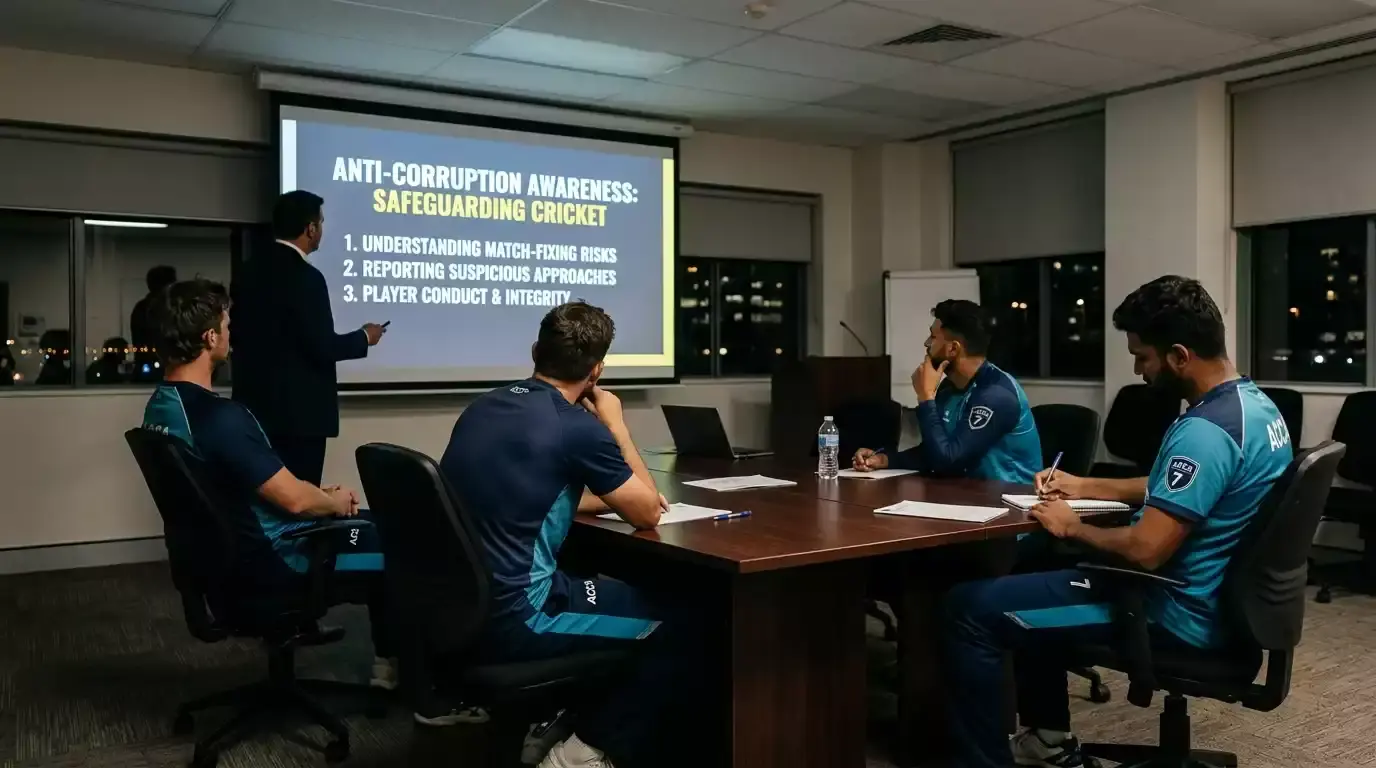
The education component isn’t a soft adjunct to the surveillance work. It’s the part of the integrity stack that addresses approach attempts before they become formal cases. A player who has done the education modules knows what an approach looks like, knows the reporting obligation, and knows the consequences of not reporting. The combination of detection (UFDS) plus education plus enforcement (ICC ACU and national boards) is what the integrity infrastructure looks like in totality.
For punters this matters indirectly. The education infrastructure reduces the supply of corruptible insiders, which in turn raises the cost and risk for corruptors and concentrates remaining activity in the segments where education is patchiest. That concentration is what the 2025 numbers show — corruption migrating toward the leagues where the institutional infrastructure is weakest. The UK regulated market is at the opposite end of that distribution, which is structurally reassuring for anyone betting on UKGC-licensed operators on mainstream cricket fixtures.
The other half of the integrity infrastructure is the enforcement layer, which is the subject of my piece on the ICC Anti-Corruption Unit and how it monitors international cricket.
