


Calculating Expected Value in UK Cricket Odds
I have a friend who finished last cricket season up 60 percent on stake. He also lost money. That is not a contradiction — it is the single most important sentence in this entire guide. He won more bets than he lost, picked a string of correct outright winners, called the Ashes 2025-26 result before the first toss, and his bank balance still went down. The reason is the price he was getting was not the price he should have been getting, and over a thousand bets the gap closed his account. To maximize your edge and find better prices, you should consider learning the mechanics of cricket exchange betting instead of relying solely on traditional sportsbooks.
Value betting is the discipline of caring about the price more than the result. Winners come and go. The price you took on a winning bet, measured against the price the market eventually settled to, is the only thing that tells you whether you were right or lucky. Eight years of trading the UK cricket card has taught me one rule: pick a side at 11/8 that the closing line will mark down to 6/4, and you have made money even if the bet loses. Pick a side at 6/4 that closes at 11/8, and you have lost money even if the bet wins.
This guide is a methodology. It assumes you already know what fractional odds are, that you have a UKGC-licensed account, that you can read a scorecard. What it adds is the maths underneath — implied probability, overround, edge, closing line value, bankroll discipline, and the few places in the UK cricket market where soft lines still exist in 2026.
Fractional to Decimal to Implied: The Three Numbers Behind Every Price
Three numbers describe every bet you will ever place. Fractional odds tell you the profit-to-stake ratio. Decimal odds tell you the total return including stake. Implied probability tells you what the bookmaker thinks is going to happen. The three are the same information dressed differently, and converting between them is the single most useful arithmetic in a punter’s toolkit.
Fractional odds are the UK standard. A price of 7/4 means stake four, profit seven. That same price expressed as decimal odds is 2.75, meaning a £1 bet returns £2.75 total. The conversion from fractional to decimal is straightforward: divide the numerator by the denominator, add one. Seven divided by four is 1.75. Plus one is 2.75. The decimal version is the format every modelling exercise uses, every spreadsheet uses, every exchange uses. Fractional is the customer-facing label. Decimal is the working currency.

Implied probability is the percentage chance the price represents. The formula is one divided by the decimal odds, expressed as a percentage. A decimal price of 2.75 has an implied probability of 1 divided by 2.75, which is 0.3636, or 36.4 percent. That number is what the bookmaker is telling you about the event — they believe there is a 36.4 percent chance of this outcome, before margin is added. Surrey at 7/4 to win Division 1 in 2026 carries an implied probability of 36.4 percent for the season. If your own analysis says Surrey are closer to 45 percent likely, that is a 9-point edge — and the bet has positive expected value at the price quoted.
The reverse conversion matters when you build your own models. If your work says a player has a 42 percent chance of being top batsman, the fair decimal odds are 1 divided by 0.42, which is 2.38. Anything offered longer than 2.38 — 11/8, 6/4, 13/8, anything above 1.38 in profit terms — is positive value. Anything offered shorter is negative. The arithmetic is unforgiving, and it is the basis of every value bet ever placed.
Overround, Margin, No-Vig Prices: What the Bookmaker Adds
The bookmaker’s margin is built into every line on the board, and most punters never look at it directly. They should. The margin determines whether the price you are taking is fair, generous, or quietly extortionate.
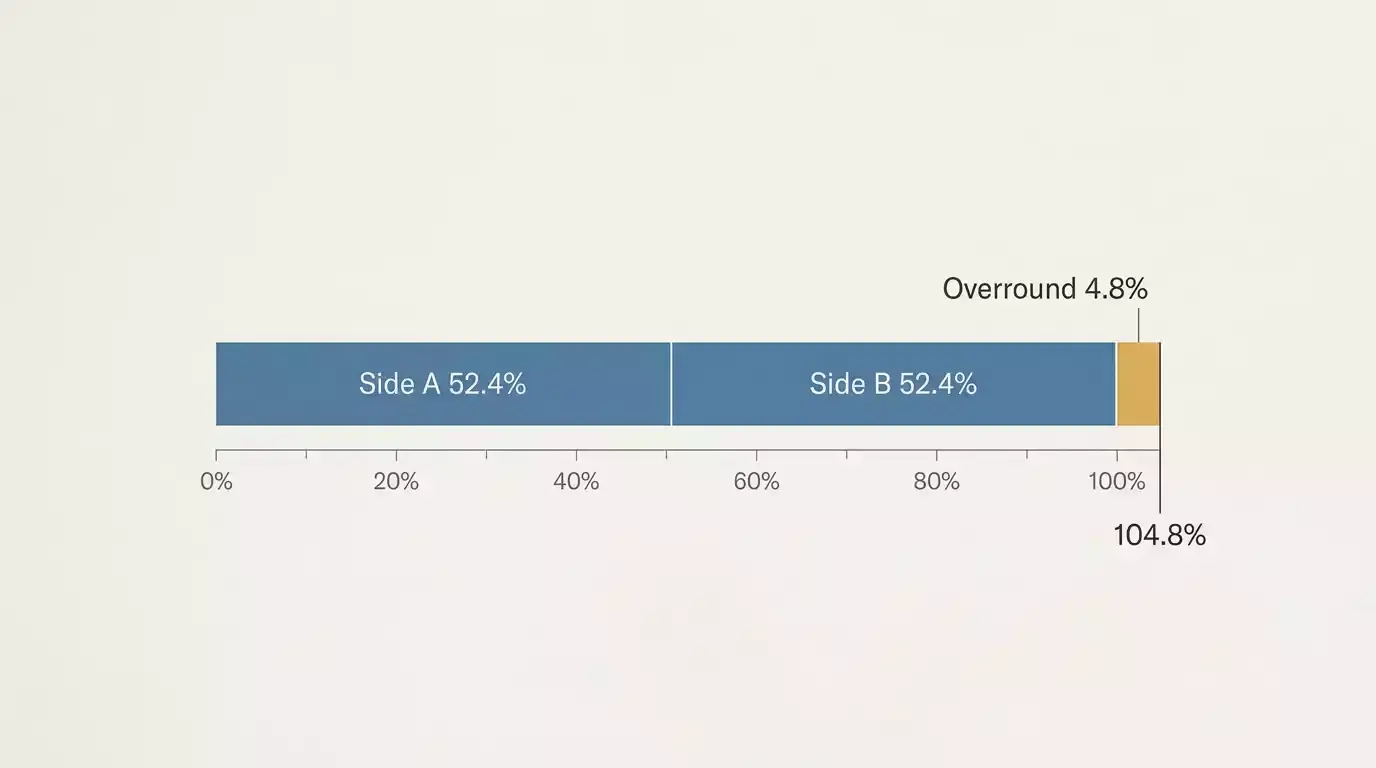
Overround is the sum of implied probabilities across all outcomes of a market. In a perfectly fair two-way market — say, a coin flip — both outcomes should price at 2.00 decimal, giving implied probabilities of 50 percent each, summing to 100 percent. No margin. Pure value. That market does not exist on any sportsbook. What you actually see is a two-way market priced at 10/11 each side. Decimal that is 1.91 and 1.91. Implied probability 52.4 percent and 52.4 percent. Total: 104.8 percent. The 4.8 points above 100 is the operator margin — the overround.
Three-way and multi-runner markets stack the same way. A County Championship outright with twelve runners might show implied probabilities summing to 118 percent. That is an 18-point overround across the field, roughly 1.5 percent of margin per runner if it were evenly distributed. It is not evenly distributed. Margin gets concentrated on the long shots, where the operator wants to discourage casual punters from hammering 50/1 outsiders.
No-vig prices are the fair prices with the margin stripped out. The standard method is to divide each outcome’s implied probability by the total overround, then convert back to odds. Take that 104.8 percent two-way market: 52.4 divided by 104.8 is 50.0 percent. Both sides land at 50 percent. The no-vig decimal is 2.00 each, or evens — exactly what the underlying event should price at. The 1.91 you are seeing is the fair 2.00 minus margin.
Why this matters: comparing your model to the offered price gives you a misleading edge if you do not strip margin first. If your model says 55 percent for Side A, and the market offers 10/11 (52.4 percent implied), that looks like a 2.6-point edge. After stripping the overround, the market’s actual fair estimate is 50 percent. Your true edge is 5 points, not 2.6. The reverse also happens — markets you think you are crushing turn out to be margin gaps, not opinion gaps.
Where Edge Lives: Soft Lines, Lower Divisions, Women’s Cricket, Niche Props
Yield Sec’s CEO Ismail Vali described the UK gambling structure in a 2025 briefing as comprising “around 700 unlicensed operators promoted by more than 1,600 affiliates, operating alongside the legal market of over 2,000 licensed operators generating £3.9bn in revenue and promoted by nearly 7,000 affiliates.” That is a thumbnail of where the money flows — and crucially, where it does not. The 2,000-plus licensed operators do not all model cricket equally well. Some price the IPL flawlessly and price the County Championship like a horoscope. That asymmetry is where edge lives.
I have spent eight years following the soft lines, and three observations have held up across every season. First, lines on lower-liquidity competitions move more slowly because there is less money to move them. Second, line shaping in white-ball cricket is dominated by the IPL pricing model, and operators struggle to adapt it to UK domestic conditions. Third, the books that take the most volume on football are the books that pay least attention to a Wednesday-afternoon County Championship Division 2 match at Chester-le-Street.
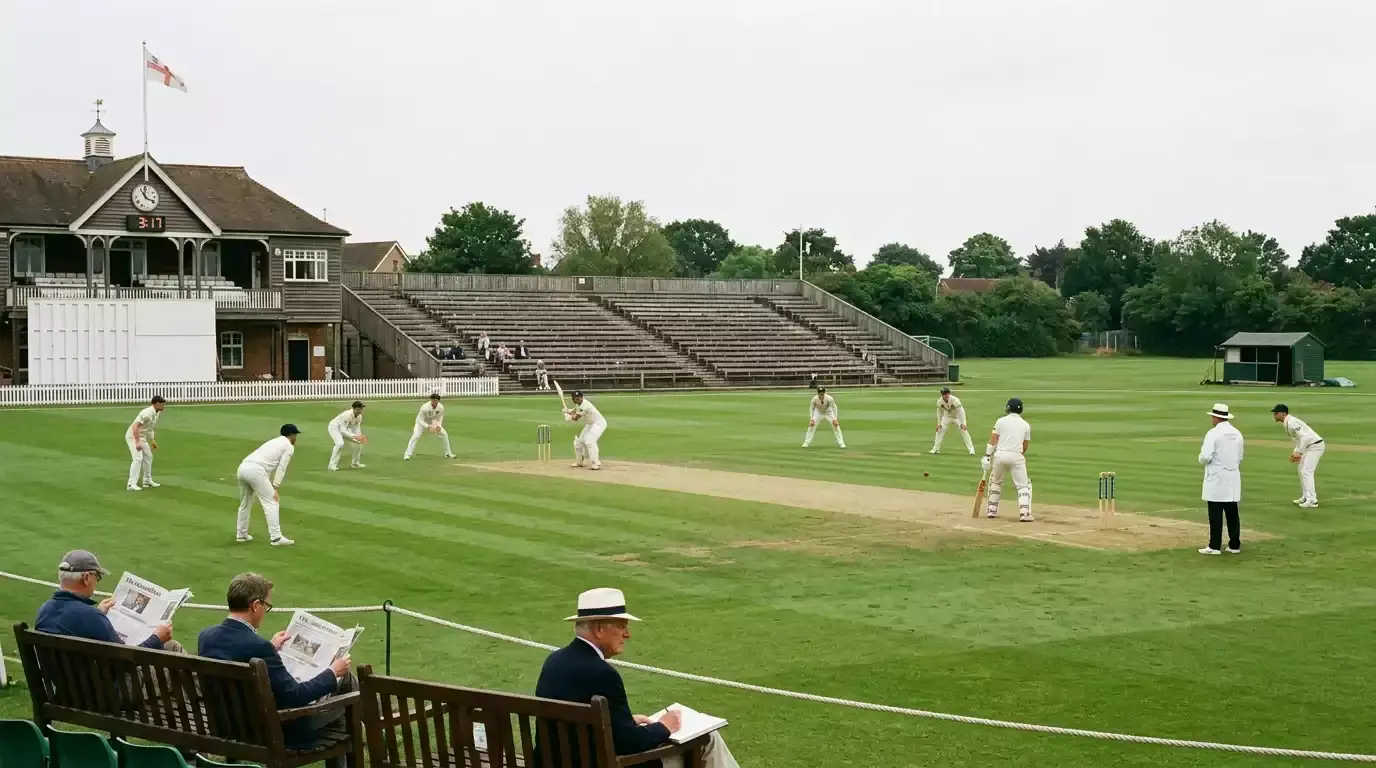
County Championship Division 2 is the most under-modelled competition on the UK card. Outright prices update infrequently, individual match prices often lag by hours after team news, and the prop markets — top batsman by side, fall of next wicket — are set by traders splitting attention across thirty sports. I have seen the same player priced at 11/2 to be top batsman on one book and 7/2 on another for the same fixture an hour before play. That is not noise — that is two pricing engines reaching different conclusions about the same event. Pick the longer price, every time.
Women’s cricket is the same story compressed into a smaller competition map. The Vitality Blast Women’s competition, the Charlotte Edwards Cup, the Rachael Heyhoe Flint Trophy — all priced thinner, all watched less, all carry the same structural inefficiencies. Prices on top scorer markets routinely diverge between operators by 15 to 25 percent of implied probability. The downside is liquidity — bet limits on women’s markets sit between £50 and £200 on most UK books, and large positions are not feasible. The edge per unit is real. The total deployable bankroll is small.
Niche props are the third soft surface. Method of dismissal, fall of next wicket, partnership runs — these are markets where the operator is running base rates rather than per-match modelling. If you have a view on a specific matchup that diverges from base rates, you have edge. The full taxonomy of these markets sits in our guide on every type a UK punter will see on a card; here, the point is that the markets with the highest variance from operator to operator are also the markets where soft lines persist longest.
Model vs Market: Building a Personal Fair-Price Estimate
The hardest question in betting is not what you think will happen. It is how much you think it will happen. The first number anyone can guess. The second is the work.
A personal fair-price estimate is the probability your model assigns to an outcome, converted into the decimal odds you would offer if you were running the book. It is your number, before any market input, before any operator margin. You compare it against the offered price, and the gap is your edge — positive, negative, or thin.
Building one does not require a PhD. The simplest model that works for cricket starts with historical base rates. For a player-prop market — say, “Player X over 1.5 sixes” — pull the player’s last 20 T20 innings. Count how many had two or more sixes. That ratio is your base rate. If 11 of the last 20 innings had two or more sixes, your base estimate is 55 percent. The fair decimal price is 1 divided by 0.55, which is 1.82. If the market is offering 2.10, you have edge. If it is offering 1.70, you do not.
The model gets refined with adjustments. Matchup against bowling type — does the player struggle against left-arm pace? Venue effects — short boundaries favour aerial hitters. Recent form — six-rate over the last five matches versus the trailing 20. Each adjustment moves your base rate by a few percentage points. The full model is rarely complicated. It is base rate plus three or four conditioning factors, weighted by your subjective confidence in each.
The mistake I see new bettors make is treating the model as truth. It is not. The model is your best estimate given imperfect information, and it competes against the operator’s best estimate given the same imperfect information. The difference is that the operator is right on average — that is how they stay in business. Your model needs to be right not just sometimes, but more right than theirs on the specific bets you place. That is a much higher bar than “I think Side A will win”.
The discipline that separates serious value bettors from casual ones is the willingness to walk away from a market when the model and the price agree. Most lines on a UK cricket card are accurately priced. The job is to find the few that are not, not to bet the ones that are.
Bankroll, Unit Sizing, Fractional Kelly
I lost half my starting bank in my second season because I sized every bet identically and ran into a 14-bet losing streak that statistically I should have expected. Variance in cricket is brutal — a five-percent edge can drop you 20 units down before the long-run reasserts itself. Bankroll discipline is the only thing standing between an edge and a bust.
The starting point is the bank itself. A betting bank is money you can afford to lose entirely without any change to your standard of living. It is not your savings, it is not your salary, it is not money earmarked for anything else. The £150-over-30-days affordability check threshold that UKGC operators apply is not arbitrary — it is calibrated to the deposit pattern that triggers a financial vulnerability review. If you are depositing more than £150 in a 30-day rolling window on a regular basis, your operator will at some point ask for proof of funds. That is the floor of “this person is gambling at scale.” Your bank should reflect what you can lose at that scale without consequence.
Unit sizing is the next decision. The unit is the standardised stake on a flat bet — typically one to two percent of bank. A £2,000 bank with a 1 percent unit sizes flat bets at £20. Larger units increase variance and the risk of ruin. Smaller units reduce variance but also reduce the absolute return on every winning bet.

Fractional Kelly is the more sophisticated approach. The Kelly criterion calculates the optimal stake fraction for a bet given the bank size, the offered odds, and the model probability. The formula is f = (bp – q) / b, where b is the net decimal odds minus one, p is your model probability, and q is one minus p. A 5 percent edge at decimal 2.00 gives a Kelly fraction of 5 percent. That is aggressive — full Kelly will produce big drawdowns on a bad run.
The discipline most professional bettors use is half-Kelly or quarter-Kelly. Stake half or a quarter of the Kelly-recommended fraction. The expected long-run growth is slightly lower, but the drawdowns are substantially smaller. For most UK cricket bettors, half-Kelly on a verified edge is the sweet spot — enough to compound returns, not enough to wipe the bank on a six-loss streak.
Closing Line Value: The Only Metric That Validates Skill
Anyone can be lucky for a season. The metric that tells you whether you are skilled is closing line value, and it is the single measurement I trust above any profit-and-loss number.
Closing line value is the difference between the price you took on a bet and the price the market settled at by the time the event began. If you backed Surrey at 7/4 in March and the market closed at 6/4 by the first ball in April, you beat the closing line. Your bet had positive CLV. If you backed them at 6/4 and the market drifted to 7/4 by first ball, your bet had negative CLV, and you took a worse price than the market eventually agreed was fair.
Why does this matter more than the result? Because results are noise over small samples. A 5 percent edge will lose 4 of its first 10 bets perfectly normally. Across 200 bets, the noise reduces. Across 1,000 bets, the result starts to match the edge. CLV converges much faster. If you are beating the closing line on average across 50 bets, you are almost certainly identifying market mispricings, regardless of whether the bets won.
The closing line is the market’s best collective estimate of the true probability of an event. Every new piece of information — team news, weather, late money — gets absorbed by the line. By the time the market closes, it has incorporated everything anyone knows. If you consistently take prices longer than what the line eventually settles at, you are seeing something the market sees later. That is skill.
Calculating CLV is straightforward. Convert your taken decimal odds to implied probability. Convert the closing decimal odds to implied probability. Subtract closing from taken. A positive number is positive CLV. Across a sample of 100 cricket bets, an average CLV of plus 2 to 3 percent is solid evidence of edge. Plus 5 percent and above is exceptional. Anything sustained negative is a signal to stop and re-examine the model.
Tracking Every Bet: A Minimal Spreadsheet That Works
The first three seasons I bet, I tracked nothing. The fourth season I started tracking everything. The difference in my profitability between season three and season four was bigger than the difference between season one and season two. Recording bets is not optional. It is the discipline that turns guessing into analysis.
A minimal tracking spreadsheet needs eight columns. Date of bet. Event. Market. Selection. Odds taken (decimal). Stake. Closing odds (decimal, filled in when the market closes). Result. That is it. Eight columns capture everything you need to calculate strike rate, ROI, CLV, and edge across any slice you want to examine.
The arithmetic on top of those eight columns is where the value emerges. ROI is total profit divided by total stake, expressed as a percentage. A 4 percent ROI across 500 bets is a real edge. CLV per bet is the difference between implied probability of taken odds and implied probability of closing odds. Average that across your bets and you have a hard measurement of whether you are beating the market.
Slicing by market type tells you where your edge actually lives. You might be plus 7 percent ROI on outright markets, plus 2 percent on innings totals, and minus 4 percent on bet builders. Most punters discover they are profitable in one or two categories and bleeding money in the others. The right response is to bet smaller in the losing categories or stop betting them entirely.
I update my spreadsheet within an hour of every bet. The closing odds get filled in immediately before first ball. Settlement gets filled in the moment the event ends. The friction of doing this consistently is the price of admission. The bettors who skip the tracking are the bettors who never know whether they are skilled or simply running hot.
Tilt, Chasing, and Why Cricket Punishes Both Worse Than Football
The GambleAware data from December 2025 found that 19 percent of young people aged 16-24 who bet at all scored 8 or above on the PGSI scale — a marker for problem gambling. That compares with around 6 percent across adult bettors generally. Cricket, with its long fixtures, dense in-play markets, and emotional swings, sits in the same psychological category as football for risk — except worse, because the events run longer and the temptation to chase compounds across hours rather than minutes.
Tilt in cricket has a different rhythm to tilt in football. A football match lasts 90 minutes and ends. A T20 lasts three and a half hours. An ODI lasts seven. A Test lasts five days. The mental drag of holding a losing position for that duration — watching every ball, every wicket, every weather forecast — wears people down in ways a 90-minute match does not. I have seen experienced bettors throw away a profitable month in one Test because they could not stop adding stakes to a losing position they had taken on day one.
Chasing is the most expensive habit in cricket betting. It begins with a losing bet and ends with a series of progressively larger stakes designed to “win it back.” The maths are unforgiving. A bettor who loses £100 on a 5 percent edge bet needs to win £100 back at the same edge, which means staking £2,000 to expect a £100 return. Few bankrolls survive that arithmetic for long.
The defence is structural, not psychological. Stake limits per day. Deposit limits per week. A hard rule that no bet is ever larger than 2 percent of bank, regardless of how confident the view feels. UK operators offer all of these as built-in tools, and I use them as guardrails even after eight years. Discipline that depends on willpower will fail at some point. Discipline built into your operator settings will not.
Arbitrage, Stake Limits, and Why Sharp Cricket Punters Get Restricted
The first time I got my stake on a Vitality Blast top batsman market cut from £200 to £8.42, I had been with that bookmaker for less than three months. I had not arbed. I had not bet on long shots. I had simply won — consistently, on the same kind of market, by amounts that were small individually but added up. The book noticed, and the model decided I was a risk.

Arbitrage in cricket is rarer than in football because cross-operator pricing converges quickly on the same lines. The opportunity exists in a small window, usually less than a few minutes, when one operator updates a price and another has not yet. The classic arb is backing both sides of a two-way market at different operators where the combined implied probability is below 100 percent. Combined book of 97 percent — three percent guaranteed return regardless of outcome. Real, but small, and intensely policed.
Stake limits are the operator’s first response to perceived sharpness. The pattern is consistent. A new account gets full advertised limits. After a few weeks of consistent winning — particularly on niche markets like top batsman or player props — the trader flags the account. New stake limits get applied, usually without notification. Bets that would previously have gone through at £200 now cap at £25. The account is technically still active. The economics of betting profitably on it are not.
The defence against restrictions is to look like every other punter. Stake variation that matches the market average. Bets on flagship markets, not only on niche ones. Occasional losers — not deliberately, but accepting them as the price of staying under the radar. Bettors who only bet at value find themselves capped within a year. Bettors who spread their action across market types and accept variance can run accounts for considerably longer. It is not fair. It is the reality of UK sportsbook risk management, and the only honest preparation a value bettor can make. Discover more strategies to protect your bankroll and increase your ROI on our expert cricket betting site.
