

Evaluating Bookmaker Odds Across Different Cricket Formats
Run-rate is the single number that most cleanly separates the six formats a UK cricket bettor actually meets. A Test match averages around three runs per over across its full length. A 50-over ODI runs at five and a half. A T20 international clips along at eight to nine. The Hundred — by design and by ball count — frequently exceeds nine. The Vitality Blast tracks T20 internationals closely. County Championship cricket sits closest to the Test rate, but with bowling units that are deeper than international Tests and pitch behaviour that varies more wildly. Test matches require immense patience, which is especially true when analyzing Ashes series betting odds over a grueling five-match campaign.
Those numbers are not curiosities. They are the difference between a totals market that prices at 540 runs and one that prices at 184. They are the difference between a draw being a real outcome and an outcome that genuinely cannot occur. They are the reason a bet on top batsman in a Test can settle hours after you forgot you placed it, and a bet on top batsman in The Hundred can settle in the time it takes to make a cup of tea.
Eight years of pricing the UK domestic and international calendar has taught me one rule. The format is the bet. Pick a format you understand, model the conditions specific to that format, and ignore the rest. Trying to apply T20 modelling to a Test or vice versa is the fastest route to a losing season. This guide walks each format and what changes when you cross between them.
Test Cricket Betting: Five Days, Two Innings, Draw as a Real Outcome
The first Test I ever bet on professionally lasted four days and ended in a draw. The match-result book had been priced at 8/11 favourite, 7/4 underdog, 11/4 draw. I had taken the draw on day two at 7/2 because the forecast had two days of rain in it. The forecast was right. The draw landed. My account paid out at 7/2. From that match onwards I have treated Test cricket as the format where weather modelling matters more than cricket modelling, and where the draw is not a default outcome but a tradeable one.
Test pricing operates on a longer timescale than any other cricket format. Five days. Two innings per side. Roughly 90 overs per day in good light. That extended window gives every variable — weather, pitch behaviour, declaration timing, captain decisions — time to assert itself, and gives in-play markets time to reprice repeatedly across the match.
The draw is the part that confounds new Test bettors. In limited-overs cricket a draw cannot occur. In a Test, a draw is the default outcome of any match that does not produce a result within the time available. Rain, slow over rates, defensive batting on a flat pitch — any combination can produce a draw, and the historical base rate for draws in modern Tests sits between 25 and 35 percent depending on era and conditions. Pricing the draw is the single skill that separates Test bettors from white-ball bettors.
Innings totals in Test cricket are usually priced per innings rather than across the whole match. A first-innings total at Trent Bridge against a touring South Africa might land at 285.5 with overs over 5/6 and unders at 5/6. Second-innings totals adjust based on how the first innings went, the state of the pitch, and the visible behaviour of the surface. By the third and fourth innings, the totals lines reflect chase situations and pitch deterioration, and the variance widens substantially.
Top batsman markets in Test cricket are settled across a defined innings — usually the first innings of the match. Some operators offer “top batsman across the match” as a separate, longer-priced line. The skill is positional. Openers face the most balls on average; middle-order batters score more rapidly but have shorter innings; the lower order is volatile. A top-order batter at 5/1 in a Test is rarely overpriced if they are in form on a batting pitch.
Method of dismissal in Test cricket has different base rates from white-ball cricket. LBW is more common — closer to 18 percent of dismissals against 12 percent in T20. Bowled is similar at around 18 percent. Caught remains the most frequent dismissal at roughly 50 percent. Run-outs are rarer than in white-ball cricket. The base rates inform the price; matchups and pitch behaviour adjust it.
ODI Betting: 50-Over Cricket and the ICC Cycle
Fifty-over cricket has been declared dead more times than any format in the sport’s history. It is not dead. The ICC ODI cycle — the Cricket World Cup, the Champions Trophy, the bilateral series that feed into ranking points — sits at the centre of the international calendar, and from a betting perspective it remains one of the most pricing-friendly formats available.
The structural appeal for bettors is the format’s length. Fifty overs per side is enough cricket to dilute the worst of variance — a single bad over does not decide a match the way it can in T20 — while remaining short enough to settle within a day. The two-innings structure produces clean partial-event markets: first-innings total, second-innings total, runs in the powerplay, runs in the final ten overs.
Pricing in ODI cricket is mature. The IPL and the World Cup have driven a generation of pricing engines that handle 50-over cricket well, and the gap between competing operator prices on flagship ODI fixtures is usually small. Overrounds on match-winner markets sit between 4 and 7 percent depending on the operator. Totals markets carry slightly more margin, reflecting the wider variance in run totals on different surfaces.
The powerplay is the part of an ODI that produces the most distinct micro-markets. Six overs of mandatory field restrictions at the start of each innings produce a defined run-rate window. Powerplay total markets are priced at 28.5 to 45.5 depending on team and conditions. The under tends to be the better value on damper conditions; the over tends to be the better value on flat batting tracks where the new ball does not move.
The death overs — overs 41 to 50 — are the second concentrated window. Run rates in this period have risen substantially over the last decade, driven by improved boundary-hitting technique and the slow-ball revolution among bowlers. Pricing for death-overs totals has tightened as the modelling has caught up. A few seasons ago the under was usefully overpriced. In 2026 it rarely is.
Outright pricing on ODI series matters more than on T20 series because the bilateral ODI series remains the building block of the ranking-points system. A five-match ODI series against a top-tier opponent will see prices update across the series, and the cumulative information value of each match is higher than in T20. Skilled bettors who follow series rather than individual matches find more edges in ODI than almost anywhere else on the international calendar.
T20 International Betting: Variance, Powerplay, the Death Overs
The first international T20 I bet on with any real stake was the 2009 ICC World T20 in England. The format was new, the pricing was crude, and the variance was punishing. Sixteen years later the pricing has caught up — barely — but the variance is the same. T20 is the format where genuinely good models lose money for sustained periods because the sample of match outcomes never converges fast enough to validate the work.
A T20 international is 20 overs per side. Two innings. Roughly three hours from first ball to last. The pricing engines that handle T20 best are the ones that treat the match as 240 separate ball-by-ball events rather than as a single contest. That granular approach produces a card that lists matchwinner, innings totals, top batsman, top bowler, partnership over/unders, player props, method of dismissal, and a deep tower of in-play micro-markets.
The powerplay in T20 — first six overs of each innings — is the most concentrated betting window in the format. Powerplay total markets are priced between 38.5 and 58.5 depending on team, opposition and ground. The over is the higher-variance side of the line because powerplay runs are dominated by boundary scoring, and a single batter who connects cleanly can shift the total by 10 to 20 runs in 12 balls.
Death overs in T20 — overs 16 to 20 — are even more concentrated. Run rates in the death are now routinely above 11 per over for top-tier teams. The pricing reflects that. Death-overs total markets sit between 45.5 and 70.5. Variance is wide because death-overs cricket is dominated by either a finishing batter teeing off or a bowling unit holding things down — there is rarely a middle outcome.
Top batsman in a T20 international is one of the highest-variance markets on the card. Innings end quickly. A top-order batter who hits 60 off 30 balls might be top batsman; an opener who falls cheaply leaves the market wide open. Prices on the favourites tend to be short — 5/2, 3/1, 7/2 — and prices on the lower order can be 80/1 or longer, with no real fixed pricing logic at the long end of the market. The high-variance long shots win the market more often than the implied probabilities suggest, and that asymmetry is the basis of one of the few persistent edges available in T20 international props.
The Hundred Betting: 100 Balls, Sets of Five, Strategic Compression
The Hundred is the format that rewrote what an over even meant. 100 balls per innings instead of 120. Sets of 5 balls instead of overs of 6. The same bowler can bowl two sets back-to-back. The rule pack is just unfamiliar enough that the pricing engines that handle other formats well make consistent errors when applied to it.
The structural change is the set-of-five. Where a T20 over of six balls produces a defined block of pressure, a set of five compresses the unit. Bowlers can be brought into the attack in pairs, releasing one bowler from the death-overs trap by giving them an early double-up. Batters face shorter rotations of bowlers and can target specific matchups more aggressively. The match plays faster than a T20 even though the ball count is only 20 fewer.
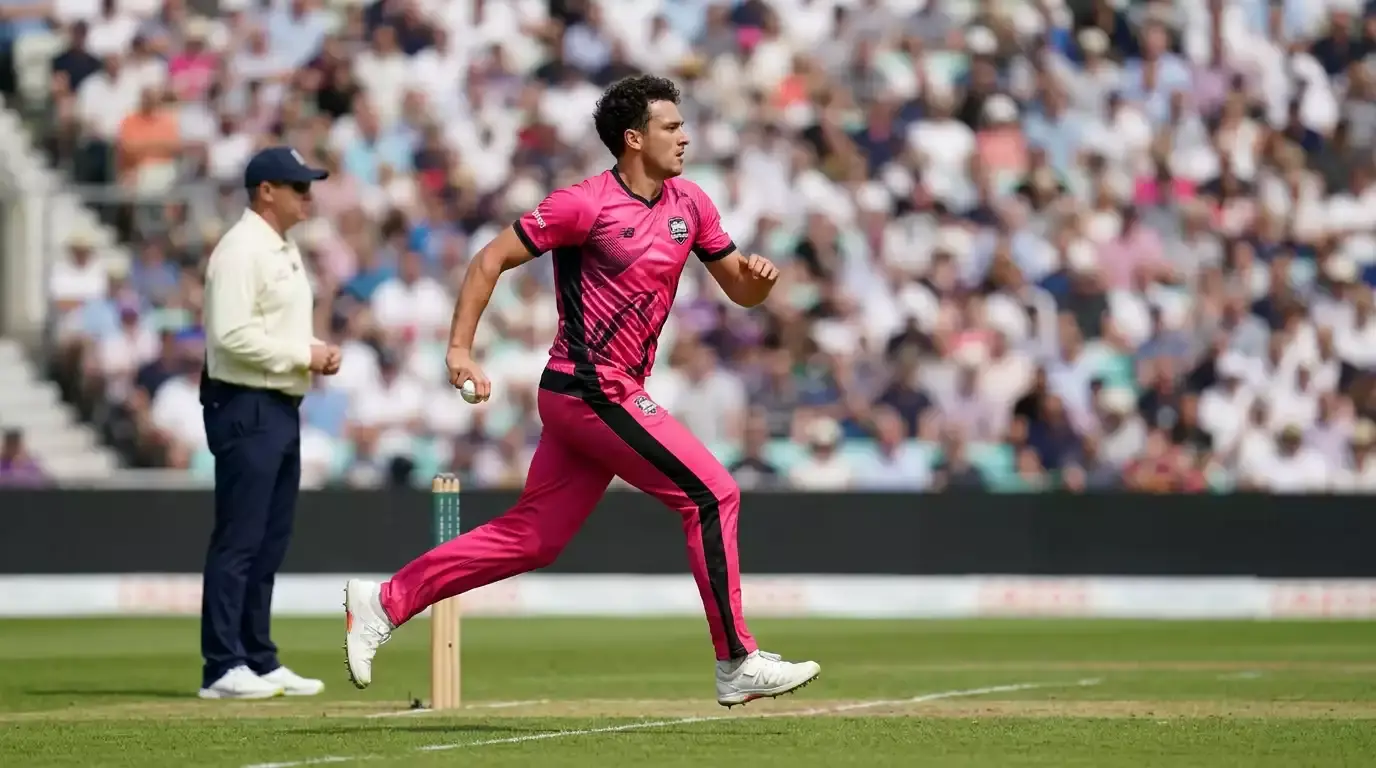
The pricing implications are real. Innings totals in The Hundred sit around 160 on a typical surface. Variance is comparable to T20 but compressed into 100 balls, which means the per-ball volatility is higher. That higher per-ball volatility makes in-play markets in The Hundred move more aggressively than T20 in-play markets, and creates more reprice events for the operator’s engine to handle.
The double-set rule for bowlers is the pricing factor most often mishandled. A bowler who bowls two consecutive sets is bowling 10 balls of pressure against batters who have not seen that bowler for any rest period. The matchup is closer to a 10-ball bowling spell than to two separate 5-ball blocks. Bowling-figures markets for bowlers in The Hundred — economy rate, wickets — should reflect that compression, and on some operators they do not. The economy lines for a strike bowler bowling early consecutive sets are reliably mispriced upward, which means the under is more often the value side.
Top batsman in The Hundred behaves like an accelerated T20 top batsman market. The favourites are short because the openers face the most balls. The lower order is heavily long-priced and rarely wins. The variance edge sits with batters in the middle order who can target specific bowlers given the matchup flexibility the set structure provides. Pricing on those middle-order batters is sometimes 25/1 or longer when the matchup analysis would put them closer to 12/1 in implied probability.
The deeper taxonomy of the markets you will meet on a Hundred card — the partnership over/unders, the fall-of-next-wicket, the method of dismissal — works the same as in T20 but with the timing compressed. The full breakdown sits in our guide to every market type a UK punter will see on a card.
Vitality Blast Betting: 18 Teams, 133 Matches, Domestic T20
The 2025 Vitality Blast ran from 29 May to 13 September. Eighteen teams. 133 matches. Somerset took the title for a third time, with Toby Albert leading the run-scoring chart at 633 runs for Hampshire and Riley Meredith heading the wicket column with 28 for Somerset. Those numbers are the spine of how a Blast betting card looks from a punter’s perspective — high volume, mature data, and operator pricing that has had over a decade to settle into shape.
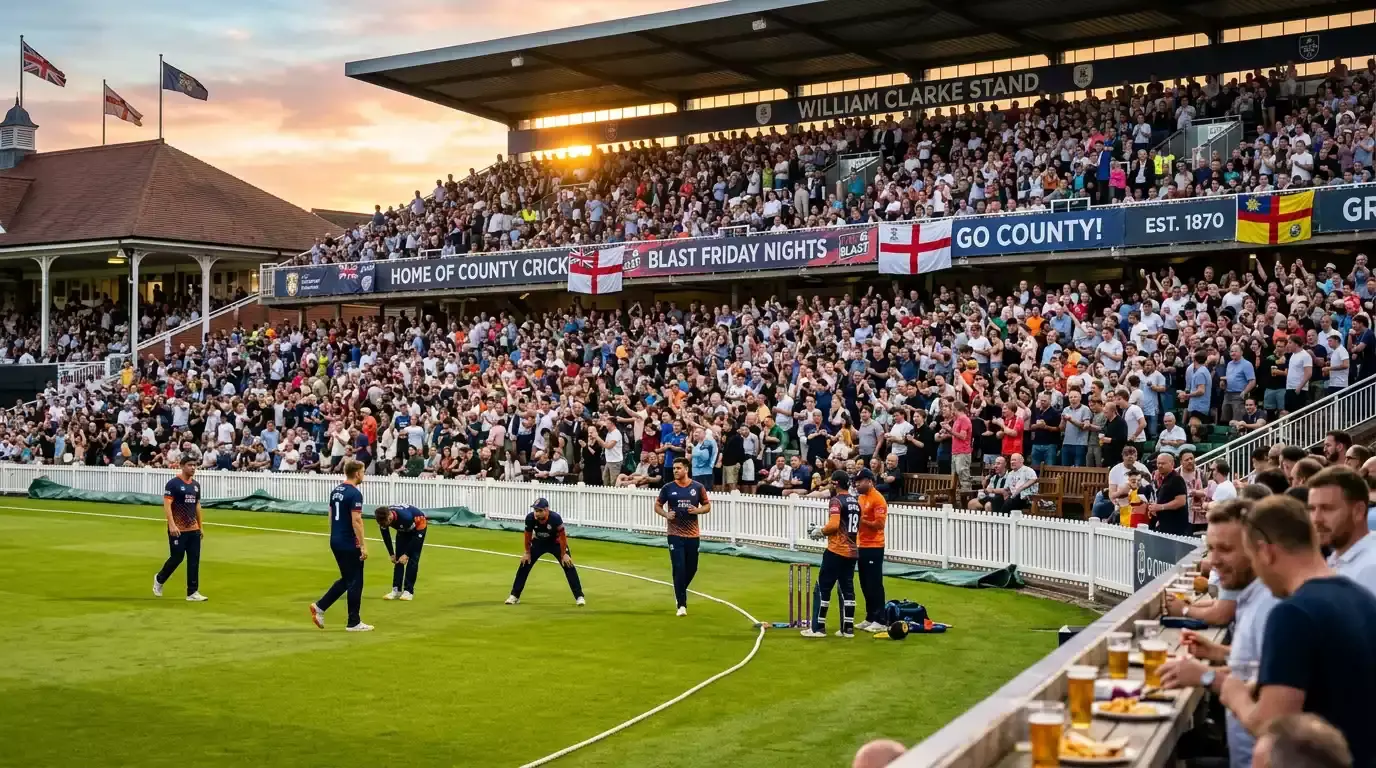
The Blast sits in a different category from international T20 because the depth of the competition exceeds the depth of operator modelling on the longer tail. Eighteen teams produce 17 fixtures each across the group phase. The flagship matchups — Surrey at the Oval, Lancashire at Old Trafford, Somerset at Taunton — get sharp pricing because they draw the most volume. The midweek fixtures between mid-table sides in Division B, played in front of smaller crowds and with lower television exposure, get pricing that lags the consensus by half a point or more on flagship lines and considerably more on prop markets.
Top batsman markets in Vitality Blast cricket reward homework. Operator pricing engines tend to anchor on full-season strike-rate averages, which under-weight short-term form swings and matchup-specific factors. A batter who has scored two consecutive fifties going into a fixture against a bowling unit that struggles against his preferred scoring areas is often priced at 11/2 when the matchup-adjusted fair price is closer to 4/1. That gap is the working capital of a Blast-specialist bettor.
Outright markets in the Blast are the slowest-moving on the UK domestic calendar. Tournament-winner prices update at the end of each group-stage round and again around quarter-final draws. Group-stage outright prices — which division a team will top, top three positions — move more sharply because the points table changes match by match. Each-way pricing on group outrights is generous if you have a view on the second and third positions in a division.
The prop market depth in the Blast varies dramatically between operators. The biggest UK books offer top batsman per side, fall of next wicket per innings, partnership over/unders, method of dismissal, player sixes, player fours, bowler wickets and bowler economy. Smaller operators offer a fraction of that depth and tend to price the markets they do offer more conservatively. Cross-operator comparison on Blast prop markets is where I spend most of my pre-fixture research time — the divergence is genuinely useful, and the bet limits on most prop markets are large enough to place meaningful positions without flagging the operator’s risk model.
County Championship Betting: Division 1, Division 2, Outrights, Wooden Spoon
The 2026 County Championship begins on 3 April. Surrey are priced at 7/4 to retain the Division 1 title. Durham are 5/7 favourites to win Division 2 promotion. Those two numbers tell a UK bettor more about the working assumptions of operator pricing engines than any data sheet I could write — Surrey have dominated the modern Championship to the point that the bookmaker has essentially priced them as the default winner, and Durham’s drop into Division 2 with a strong squad has produced one of the shortest division-favourite prices the Championship has seen.
The Championship is the oldest continuously-running domestic cricket competition in the world and the slowest-moving betting market on the UK card. Four-day cricket. Two divisions of 10 teams. Roughly 14 matches per team across April to September. Outright pricing on division winners updates after each round of matches but rarely moves more than a quarter-point unless results are genuinely surprising. Individual match pricing on a four-day fixture between two mid-table sides is something operators put up reluctantly and price defensively.
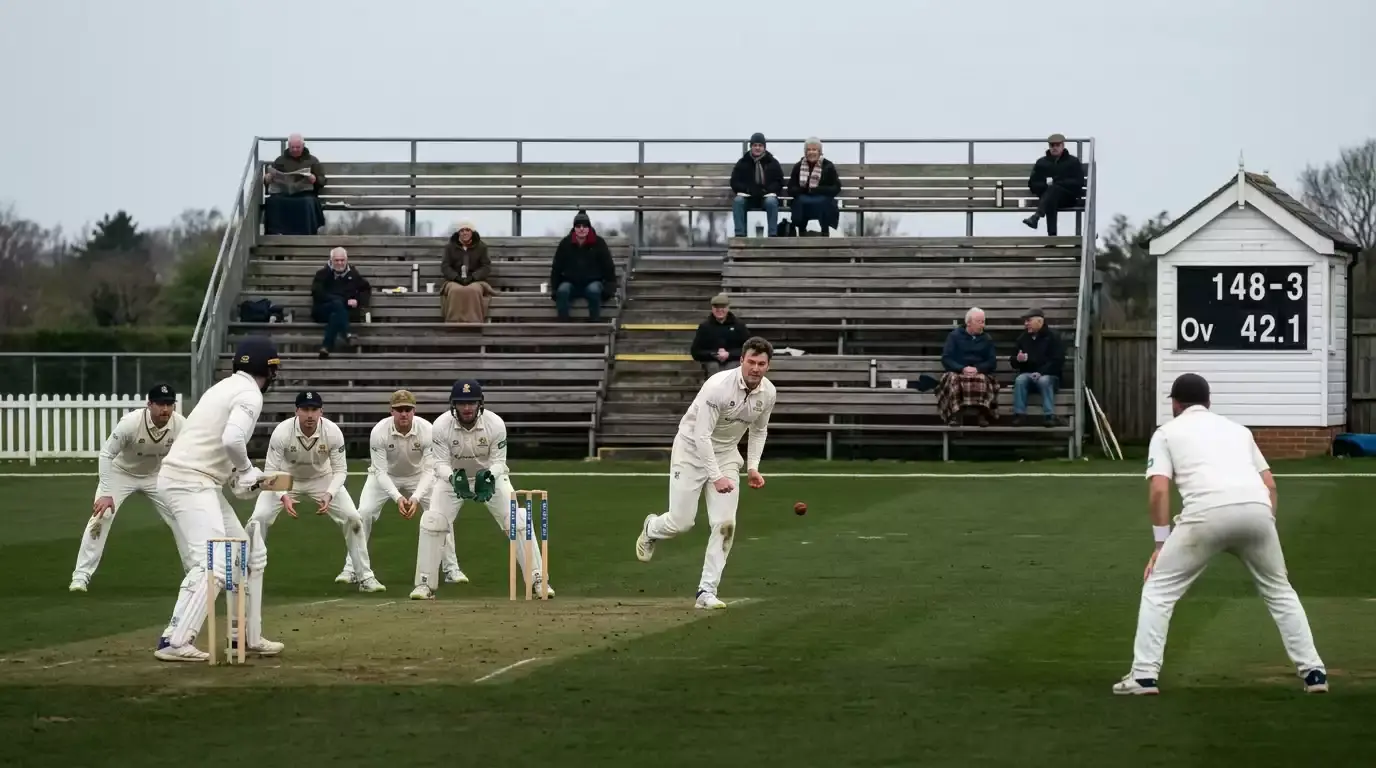
The dominant market on the Championship is outright, not individual match. Division winners, top-three finishes, relegation, the wooden-spoon market for bottom finish — all of these run across the entire season and produce the kind of analytical opportunity that suits a value-focused bettor. The pricing engines lag the underlying form by enough margin that someone willing to track team-by-team performance, injury news, and Kookaburra ball trial effects can find soft prices in early-season markets that hold value for months.
Wooden-spoon markets are particularly under-modelled. The bottom-of-table position attracts less betting volume than the title race, which means operator pricing on the unfashionable teams reflects less collective opinion. A struggling Division 2 side priced at 7/2 for the wooden spoon when the matchup analysis suggests they should be closer to 11/8 is the kind of price I have seen multiple times across recent seasons.
Individual match pricing in the Championship is dominated by the draw. Four-day cricket on traditional English pitches in April and September weather produces draws as a regular outcome — historically around 35 to 45 percent of matches across the season. The match-winner market is functionally a three-way bet between Side A, Side B, and the weather. Operators price the draw between 9/4 and 7/2 depending on conditions. The draw is the single most under-bet outcome on individual Championship matches.
The two divisions behave differently from a pricing perspective. Division 1 is sharper because squad strengths are more uniform and operator attention is focused there. Division 2 is the soft surface — squad strengths vary more widely, operator pricing is thinner, and the historical data on individual Division 2 fixtures is patchier than the Division 1 equivalent. Most of my Championship edges over the last three seasons have come from Division 2 outright and prop markets, not from Division 1.
How Weather and Pitch Behave Differently in Each Format
The same weather forecast does different things to a Test match, a T20 international, and a Vitality Blast group fixture. The same pitch reads differently across formats. Treating weather and pitch as universal inputs is one of the most expensive mistakes a UK cricket bettor can make.
In Test cricket, weather is a draw modifier first and everything else second. A forecast that includes 15 millimetres of rain across day three and day four shifts the draw probability from 30 percent to closer to 55 percent, and rebalances every market downstream. Innings totals get capped because innings cannot complete. Top batsman markets concentrate value on the openers, who will face most of the available balls. Method-of-dismissal markets shift toward caught dismissals because seam movement increases on damp surfaces.
In ODI and T20 cricket, weather affects the Duckworth-Lewis-Stern calculation more than it affects pricing. A reduced-overs match has different run-rate dynamics, different bowler usage patterns, and different death-overs windows. Innings totals are voided below operator-specific minimum-overs thresholds, which means a heavily rain-affected match settles markets you might not expect to be settled and voids markets you might expect to settle.
Pitch behaviour varies by format more than most bettors recognise. A Lord’s surface that produces a 250-run T20 first innings can produce a 180-run T20 first innings the next week on a different pitch from the same ground. The variance comes from pitch preparation choices specific to each format — a Test wicket is prepared to last five days; a T20 wicket is prepared to deliver a balanced contest in three hours.
Dew is the variable most often under-priced by operators. Day-night ODIs and T20s played in dew-prone conditions favour the side bowling second to bat second — the ball skids onto the bat once dew has accumulated. Toss markets in dew-affected conditions become genuinely tradeable because the captain who wins the toss almost always elects to chase. Pricing engines factor this in inconsistently across operators, and the inconsistency is exploitable when the matchup analysis says the dew is likely to be heavy.
The UK Cricket Betting Calendar: April to September Domestic, October to March International
The UK cricket betting calendar has two halves. From April to September the domestic competitions dominate — County Championship, Vitality Blast, The Hundred, the One-Day Cup all running in overlapping schedules. From October to March the focus shifts to international tours, ICC events, and the IPL — the wider international cycle that Sportradar covers across the more than 7,000 pre-match and live cricket matches it claims to price each year.
April to September is dense. The 2026 County Championship begins on 3 April. The One-Day Cup runs alongside it in compressed windows. The T20 Blast competition starts in late May and runs to mid-September. The Hundred runs through August. International fixtures — Tests, ODIs, T20Is at home — overlap the domestic competitions, with the bigger international tours typically scheduled across the early-summer and mid-summer windows. A serious cricket bettor in the UK summer is rarely short of fixtures.
October to March is sparser at home but international cricket continues. The Ashes touring cycle, the ICC events on their four-year and two-year cycles, the IPL across March and April, and the bilateral series that fill the gaps. The IPL specifically draws enormous betting volume in the UK because it overlaps with the British evening prime-time and the operator pricing is mature enough that match-winner overrounds compress to between 3.5 and 5 percent on flagship fixtures.
Volume varies by month. June and July are the busiest months on a UK card — multiple domestic competitions overlapping with summer internationals. November is sparser, dominated by tour cricket and limited domestic content. December and January carry the BBL, the Bangladesh Premier League, the SA20 and a sprinkle of tour cricket — enough to occupy attention but with substantially less liquidity than the peak summer fixtures.
The practical scheduling reality for a UK bettor: build modelling discipline around the formats you understand best, accept that some months will deliver fewer betting opportunities than others, and avoid the temptation to bet outside your modelling perimeter just because the calendar is thin. The lowest-volume months are when restraint matters most. You can find daily updates and format breakdowns on the leading cricket betting platform before placing your wagers.
