

Allocating Overs and Powerplay Strategies in Betting
An old Surrey assistant coach once told me that picking a top bowler in a T20 isn’t about who’s bowling well — it’s about who’s bowling. Eight seasons of betting cricket later and I still think it’s the cleanest insight on this market. Form tables tell you who has the most wickets across the season. The top-bowler card asks who’s going to take the most wickets in this specific match, on this specific surface, with a specific captain making over-allocation decisions in real time. Those are different questions, and the book prices them as if they were the same.
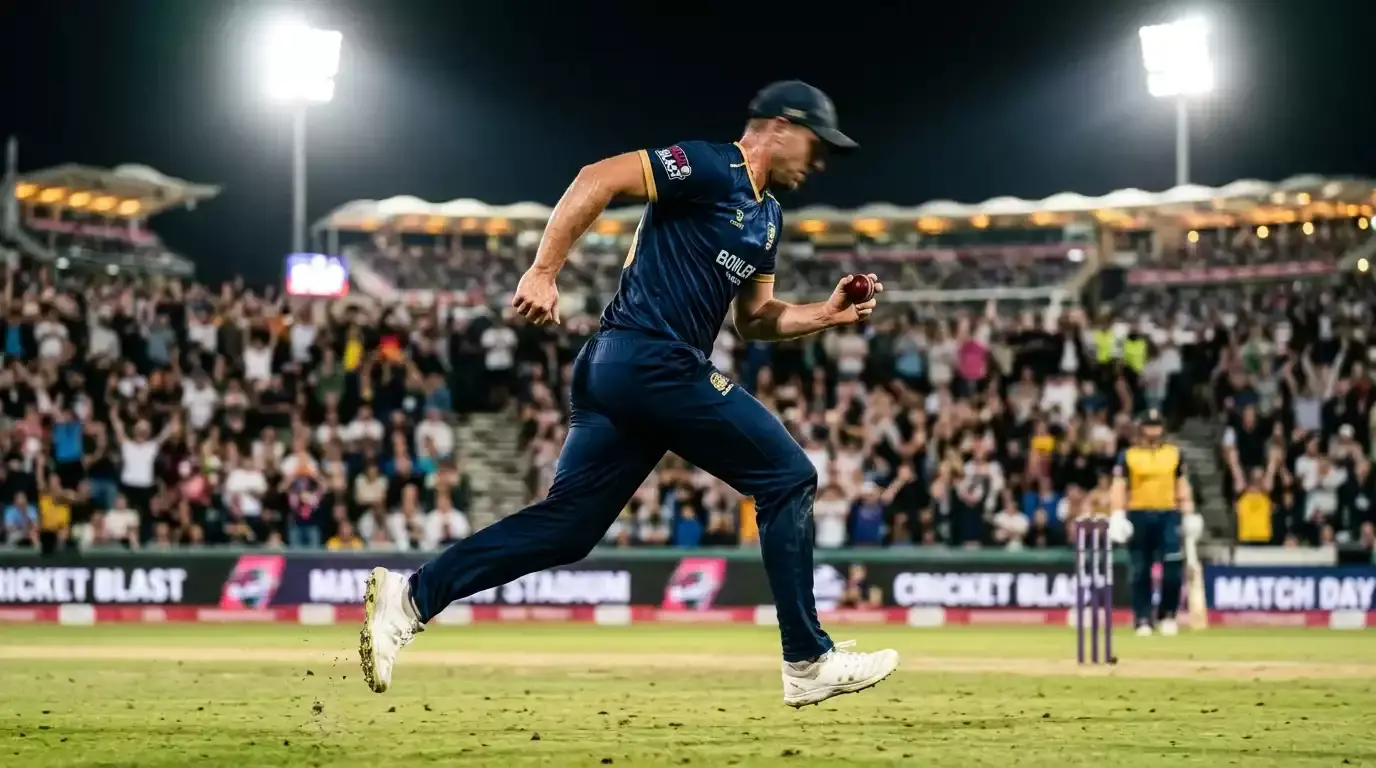
Riley Meredith took 28 wickets to lead the Vitality Blast 2025, and across the same competition I count dozens of individual matches where the actual top bowler from a given fixture wasn’t on anyone’s pre-match list. Captain decisions on over allocation, surface response, batting line-up matchups — these things turn modest seasonal numbers into match-winning bowling figures, and they’re what the disciplined punter watches more than form.
How Captains Distribute Overs: Powerplay, Middle, Death
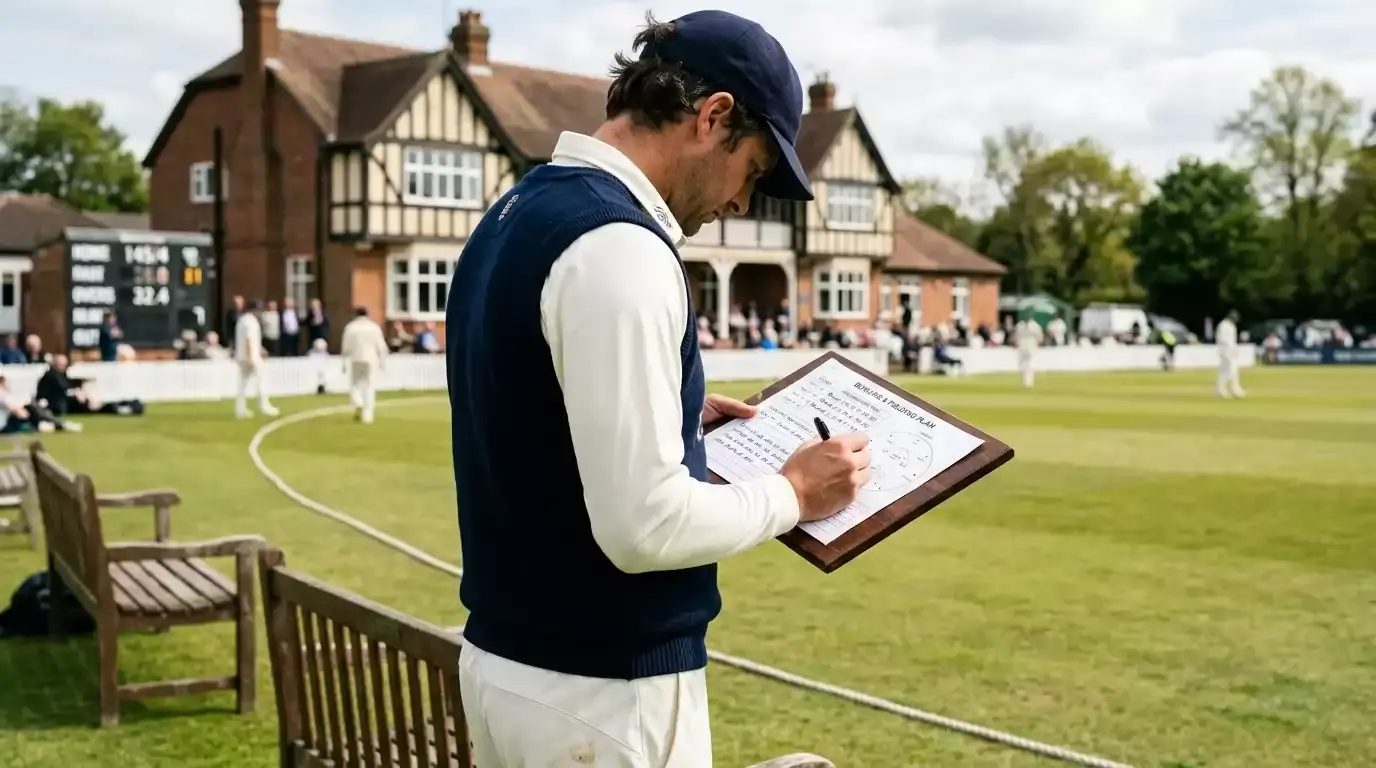
Captains allocate overs in T20 according to a rough template: a designated new-ball pair takes most of the powerplay overs, a pair of middle-overs operators bowl through overs seven to fifteen, and one or two designated death bowlers handle the final five. The top-bowler market lives or dies on how well you read which slot a bowler occupies and how the match conditions tilt the value of each slot.
Powerplay bowlers get the new ball and the fielding restrictions. Wickets in the powerplay are usually fast-bowling wickets — caught behind, bowled, LBW from movement off the seam — and the strike rate per over is higher than the middle overs. A top-bowler card that prices an opening seamer at 7/2 reflects this — the book knows the powerplay is wicket-rich.
Middle-overs bowlers are typically spinners, and their economy matters more than their wicket rate. Bowling captains use middle overs for control rather than aggression, which means a spinner who bowls four for 22 with one wicket is often a less likely top bowler than a seamer who comes back at the death and takes three for 38. The market pricing reflects this asymmetry but not perfectly — spinners are over-favoured in subcontinental matches and under-favoured in UK matches at the slow surfaces where they should be more central.
Death-overs bowlers handle the highest-pressure overs and the highest variance outcomes. The bowler who bowls the 18th, 19th and 20th overs gets the chance to take wickets when batters are forced into shots they wouldn’t normally play. A specialist death bowler — yorker artist with a slower ball — can ride the variance into multi-wicket hauls, but can also concede 60 from three overs without taking anything. The book prices death bowlers wider, which makes them interesting longshots when the conditions favour bowling.
Wicket Types Counted, and the Caught & Bowled Edge Case
Top-bowler markets count wickets where the bowler gets statistical credit — caught, bowled, LBW, caught and bowled, stumped, hit wicket. Run-outs do not count, regardless of who threw the ball or which fielder was involved. This is the rule across all UKGC-licensed operators I’ve encountered, and it costs careful readers nothing — but it costs casual punters who don’t track the run-out exclusion when their named bowler “takes” a wicket via a direct hit from mid-on.
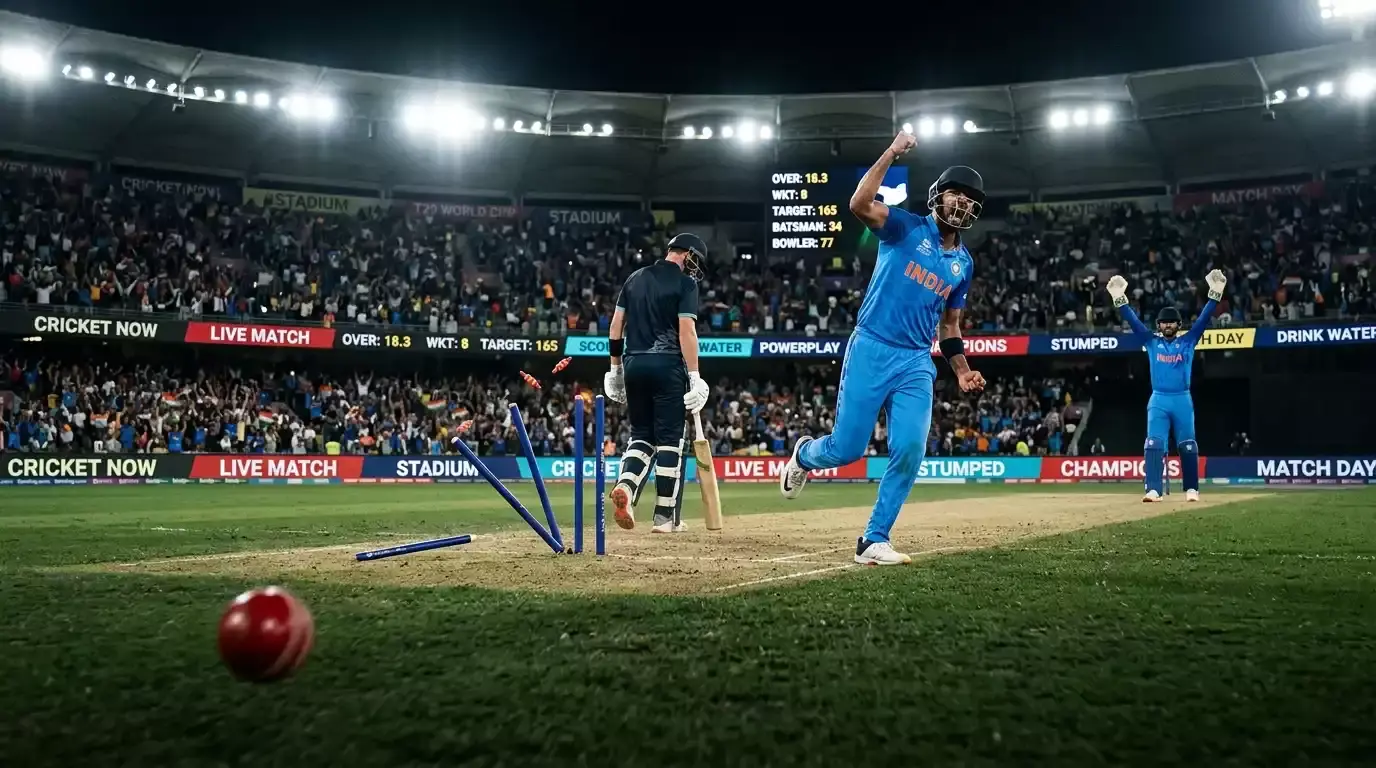
Caught and bowled is the cleanest case — the bowler gets full statistical credit because the catch happens off their own bowling. Stumped counts toward the bowler’s wicket tally even though the wicket-keeper is the immediate dismissal agent. Hit wicket counts toward the bowler. The exclusions are run-out (unless via a direct fielding action initiated by the bowler that books separately list under “assisted dismissals”, which is rare) and obstructing the field (settled to the batter’s own dismissal record without a bowler credit).
The edge case is when a bowler bowls the ball that leads to the dismissal but the wicket is awarded to a different bowler — for example, an overstepping no-ball off which a catch is taken. The catch doesn’t count because no-balls are dead deliveries in wicket-taking terms. Bowlers who concede no-balls during what would have been wicket-taking deliveries lose those wickets in the settlement. This rarely comes up in red-ball cricket but happens occasionally in T20 where front-foot no-balls are more common.
Spin-Friendly Pitches and the Domestic Bias
UK domestic spin is consistently underweighted in top-bowler markets. The book’s pricing model tends to anchor on the international spin reference points — turning subcontinental pitches, big-name spinners — and underprice the kind of moderate turn that English county surfaces produce later in the season. By August, surfaces at Old Trafford, The Oval and Edgbaston are taking spin from day one of red-ball matches and from over six of T20 matches, and the bowlers who exploit that are routinely priced 8/1 or 9/1 in top-bowler markets when their fair price would be closer to 4/1 or 5/1.
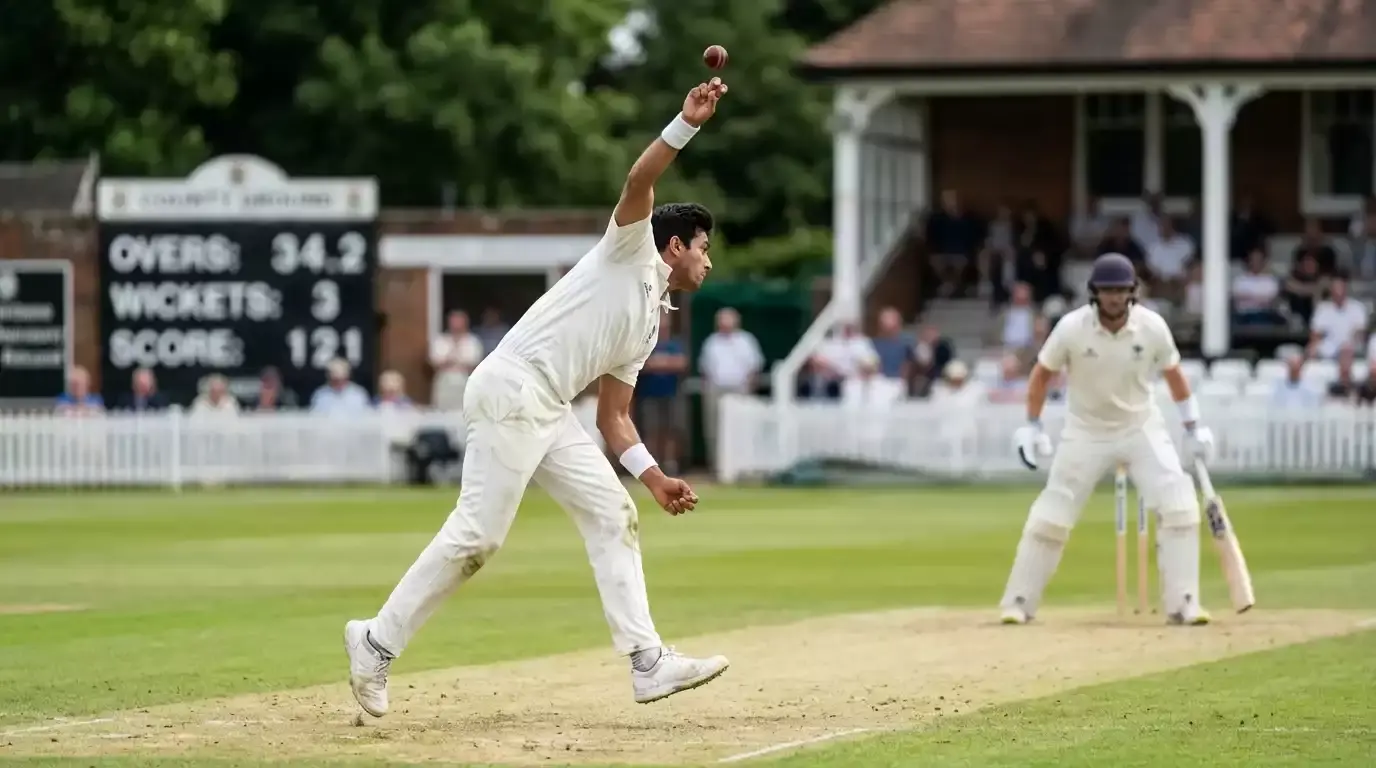
The reason is partly that the market over-indexes on raw pace and the visual impression of “wicket-taking bowling” that fast bowling produces. A spinner who takes three wickets at low cost in 16 deliveries doesn’t make the highlights reel the way a seamer who takes three wickets with edges to slip does. The book is pricing toward audience perception and against the underlying probability, which is where the disciplined punter operates.
The domestic bias is also a season-progression bias. Early in the English summer, surfaces favour seam and the market is correctly priced on opening seamers. By late June into July the wickets begin to dry, finger-spin starts to matter, and the market lags. By August, when wickets are at their driest, the gap between fair price and market price on domestic spinners is at its widest. I scale my top-bowler stakes on Blast matches by month — small early, larger as the season progresses and the surface-led edge widens.
Dead Heat in Wicket-Counting Markets
Dead heat applies to top-bowler markets in the same way it applies to top-batsman markets, with the same proportional payout reduction. Two bowlers tied on three wickets each, no one else passing two — the £10 bet at 6/1 returns £30 (£20 winnings, halved), not the headline £60.
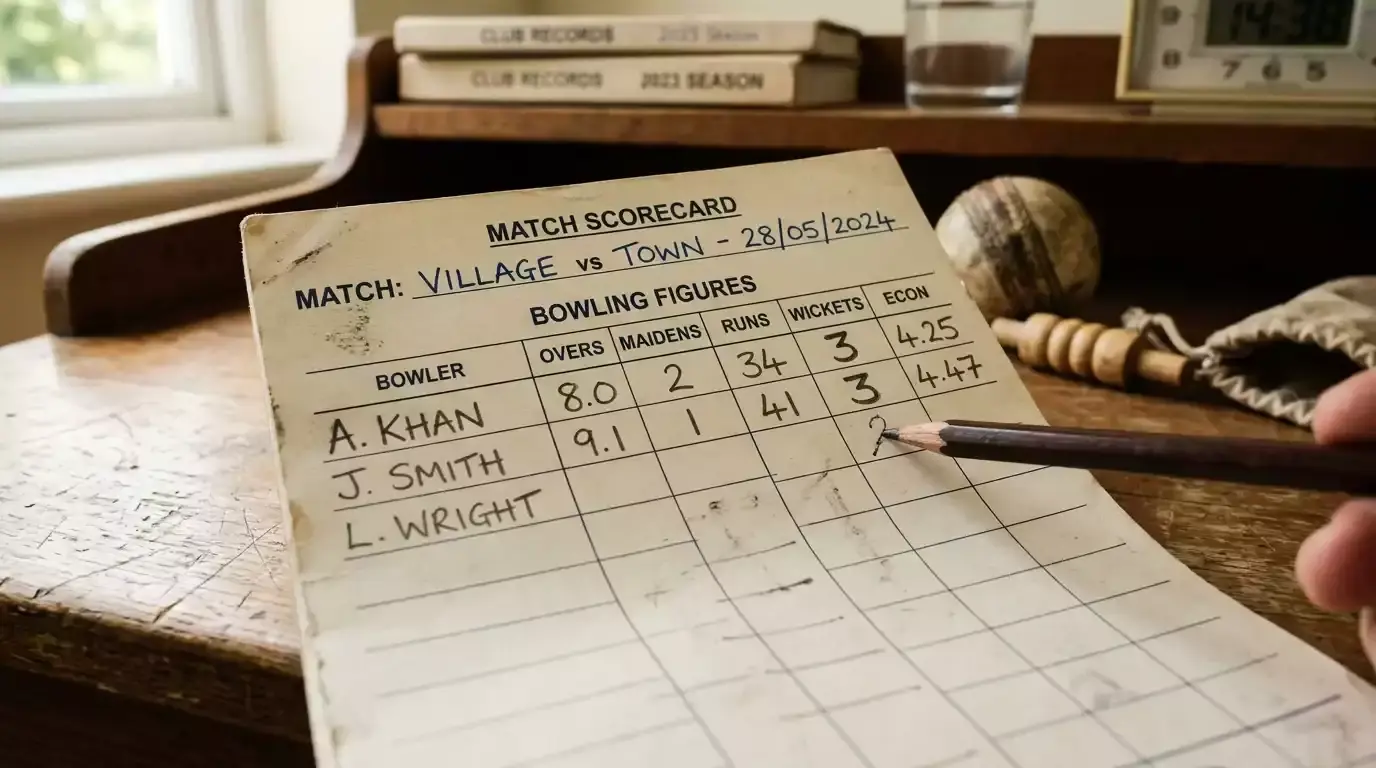
Dead heat in top-bowler is more common than punters expect because winning T20 bowling figures are typically two or three wickets, and the field of credible candidates often has three or four bowlers within a reasonable shout. From my own tracking, around 15 percent of top-bowler markets in domestic T20 settle on dead heat, which is higher than the equivalent rate in top-batsman.
The settlement is also more painful in top-bowler because winning prices are typically longer — 5/1 to 10/1 — than in top-batsman, where the favourites are clustered around 4/1. A dead-heat halving on a 10/1 backer matters more in absolute terms than the same halving on a 4/1 backer. Bowler bets are volatile, dead-heat reductions are a structural drag, and reading the probability distribution of likely top scores is one of the most valuable things a top-bowler punter can train into their pre-match routine.
The sister market that prices the batters facing these bowlers in the same innings is covered in my piece on top batsman markets and opening-position bias.
