

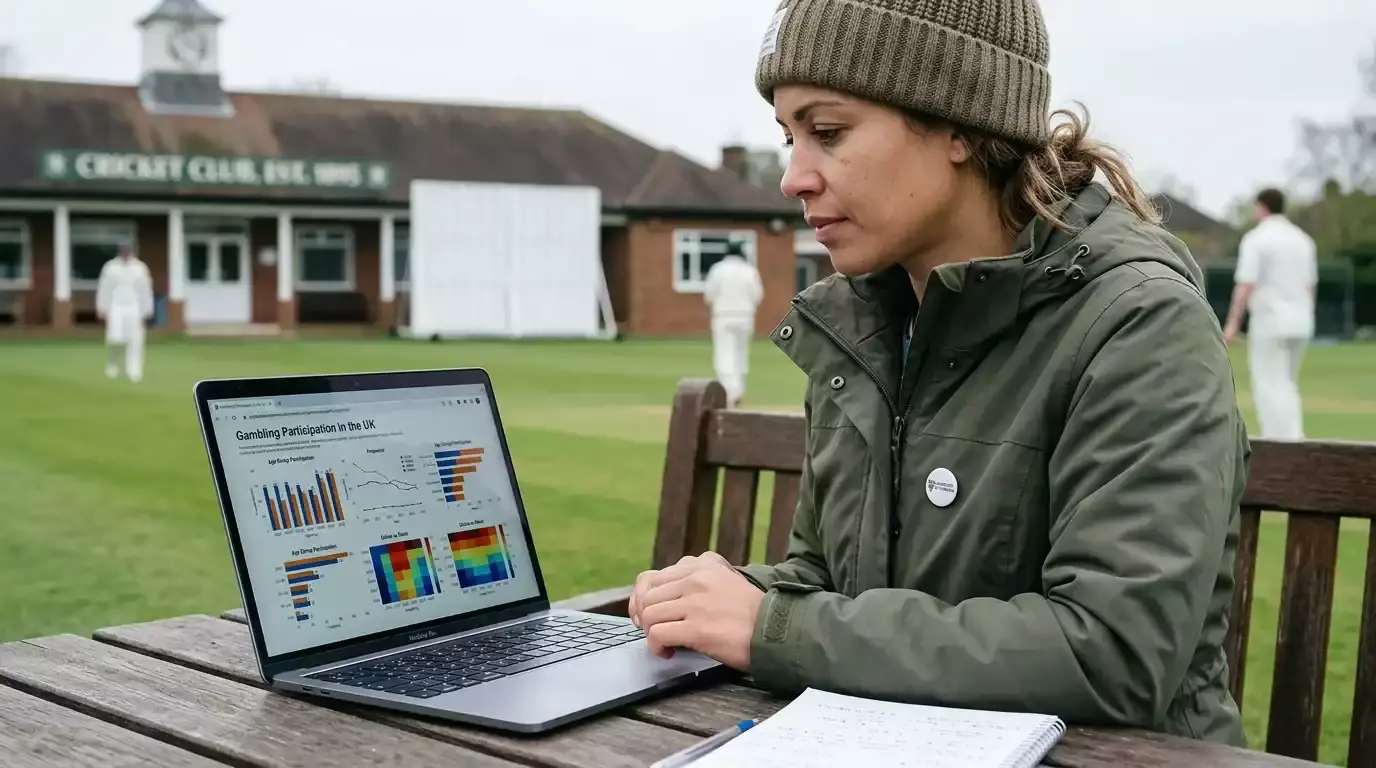
Assessing the Scope of Problem Gambling in the UK
A statistic I keep coming back to: 0.5 percent of UK adults are classified as problem gamblers. The headline rate sounds reassuring until you do the arithmetic. The UK has roughly 53 million adults. Half a percent of that is around 340,000 people — enough to fill Wembley Stadium nearly four times. Another 1.8 million sit in the “at-risk” tier on the standard scoring index. Together that’s well over two million UK adults whose gambling is causing harm by some measurable definition.

I’m a cricket betting writer, not a public health researcher, but I read the underlying numbers carefully because anyone serious about this game ends up sitting alongside people who are no longer enjoying it. The data has the texture of a useful map: it tells you where the harm clusters, which demographics are most exposed, and which interventions have produced measurable effects. None of it tells you the right answer for an individual person, but it tells you what the regulated sector is actually working against.
The PGSI Score: How Researchers Measure Gambling Harm
The Problem Gambling Severity Index — PGSI — is the standard tool for classifying gambling behaviour in the UK research apparatus. It’s a nine-question screening instrument adapted for general population surveys. Each question asks about a behaviour in the last 12 months: “betting more than you could afford to lose”, “borrowed money to gamble”, “feeling guilty about how you gamble”, and similar items. Responses score 0 to 3 each, giving a possible total of 0 to 27.

The thresholds matter. A score of 0 is “non-problem gambler”. 1 to 2 is “low-risk”, 3 to 7 is “moderate-risk”, and 8 or higher is “problem gambler”. The PGSI 8+ cohort — the “problem gambler” tier — is what gets reported when news outlets say “X percent are problem gamblers”. The at-risk cohorts, often grouped together, represent a much larger group whose behaviour is causing some level of harm even if it hasn’t crossed the highest threshold.
The instrument has been used in UK gambling surveys for over two decades. Its consistency means longitudinal data is comparable across surveys, even as the structure of UK gambling has changed. The current Gambling Survey for Great Britain — the GSGB — uses PGSI as its primary measure and runs in continuous waves rather than the older one-off survey format.
Headline 2025 Numbers: Prevalence, At-Risk, Treatment
The headline numbers from 2025 break down across three tiers. PGSI 8+ — problem gambling — sits at around 0.5 percent of UK adults, equivalent to roughly 340,000 people. PGSI 3 to 7 — moderate risk — affects approximately 2.3 percent of adults, around 1.2 million people. PGSI 1 to 2 — low risk — covers another 1 percent or so. Combined “at-risk” of any tier reaches about 1.8 million adults, with the 340,000 problem-gambling figure sitting inside that broader total.

Treatment data has moved sharply. NHS England recorded a 34 percent rise in gambling treatment presentations between 2019 and 2024. That increase is partly real — more people seeking help — and partly a function of better access, with new specialist clinics opening across England in the last five years. The absolute number of treatment cases remains modest relative to the prevalence figure, suggesting most problem gamblers don’t access formal treatment.
The GambleAware figure I find most striking is that over 5 million people in the UK reported, in late 2025, that they want to cut down or stop gambling entirely. That’s an order of magnitude larger than the PGSI 8+ figure, and it captures a much broader population — people whose gambling is unwelcome rather than acutely harmful. The five-million figure is where the wellbeing conversation actually lives, even if the PGSI 8+ figure is where the regulatory conversation focuses.
Young People: PGSI 8+ Reaches 19 Percent Among Under-25 Bettors
The single most striking number in the 2025 data is from GambleAware’s young people research: among under-25s who gamble in any form, 19 percent meet the PGSI 8+ threshold. The equivalent figure for adult gamblers overall is around 6 percent. That’s a threefold elevation in the youngest cohort relative to the broader gambling population.

Why the spike? Several drivers compound. Younger gamblers are more likely to be exposed to advertising in stream-side and social-media environments where regulatory enforcement is patchier than traditional broadcast. Younger users are more likely to use mobile-first platforms with frictionless deposit flows. The 16-to-24 cohort showed a rise from 26 to 29 percent in 2024-25 reporting that they see family members gambling — which establishes gambling as a normalised behaviour at an age when reference behaviours are forming.
“The relative stabilisation of suspicious match numbers in 2025 is encouraging, yet it reinforces the importance of continued vigilance. Match-fixing remains an evolving threat, and sustained investment in technology, intelligence, education, and collaboration is essential to staying ahead of those seeking to corrupt sport,” Andreas Krannich of Sportradar Integrity Services said in the firm’s 2026 integrity press release. The same logic applies to harm prevention as it does to integrity: stabilisation isn’t sufficient. The underlying vulnerability among younger gamblers means even flat headline numbers conceal worsening cohort exposure.
Why Harm Numbers Outstrip Prevalence Numbers in Headlines
The gap between “340,000 problem gamblers” and “5 million want to cut down” is where most of the public conversation gets lost. Both figures are correct, both come from credible sources, and they measure different things.

The PGSI 8+ figure is a clinical-style threshold. It captures behaviour that crosses a defined harm boundary across multiple dimensions — financial, psychological, relational. The five-million figure captures self-reported desire to reduce, which is a much wider behavioural and emotional category. Someone who gambles modestly but feels uneasy about it sits in the five-million pool. Someone whose gambling has clearly crossed harm thresholds sits in both pools.
The implication for the regulated sector is that compliance with affordability checks, deposit limits and self-exclusion tools is calibrated against the PGSI 8+ threshold, but the actual user demand for protection extends much further. Operators are starting to respond — better in-app friction, clearer reality-check messaging, more proactive low-stake monitoring — but the gap between “what’s required” and “what users want” is wider than the regulatory framework formally addresses. The five-million figure, in other words, is the more honest reflection of where the UK gambling user base actually sits in 2025.
The most-used practical tool for users who recognise themselves in this data is national self-exclusion, which I cover in my piece on GamStop and what it blocks and does not block.
